Alameda County’s Project Roomkey achieved major success by moving over 1,700 homeless people from a PRK hotel site into permanent housing during the COVID-19 pandemic. This achievement is a result of the incredible work and collaboration between our non-profit community of providers, the Alameda County Housing and Homelessness Services Homeless Care and Coordination and additional partners throughout Alameda County.
A study conducted in Alameda County finds that Project Roomkey improved outcomes for people experiencing homelessness. The study reports that, compared to typical shelter models, Project Roomkey’s non-congregate shelter model paired with on-site healthcare services has made shelter more appealing to people living outside, has helped address long-standing health needs, and found housing for those exiting the program at a rate nearly double that from traditional congregate shelters.
The data below is from Project Roomkey’s Operation Safer Ground, showing an Overview of Clients Served and Exits, 04/2020 through 09/30/22.
Project Roomkey: Final Operation Safer Ground Data
(As of 9/30/22)

Safer Ground All Clients Chart – clients served = 2,614, clients exited = 2,416, clients exited to housing = 1,716
Safer Ground: Details of Clients Served and Exits
(As of 9/30/22)
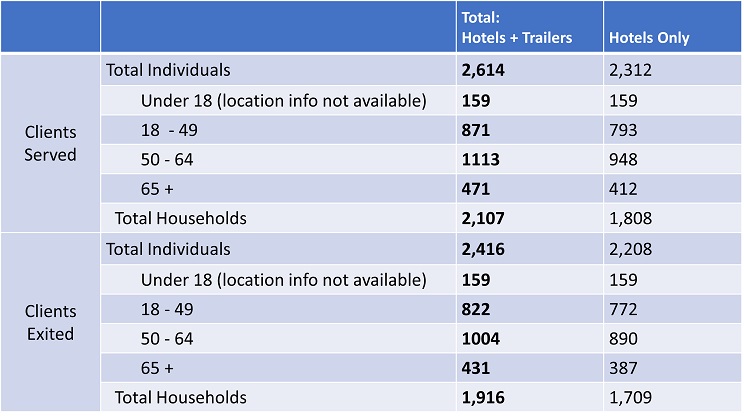
Safer Ground Clients Served and Exits – total clients served = 2,416, total clients exited = 1,916
Safer Ground: Ages of Clients Served and Exited
(As of 9/30/22)
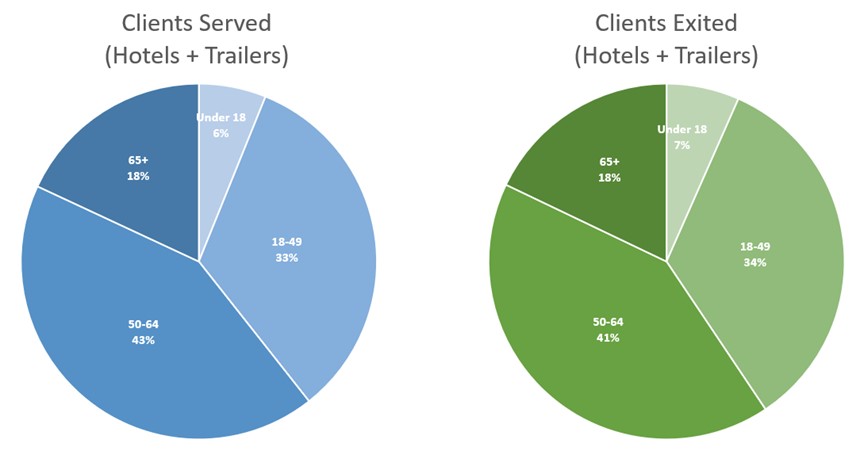
Clients served ages under 18 = 6%, clients served ages 18 – 49 = 33%, clients served ages 50 – 64 = 43%, clients served ages 65+ = 18%. Clients exited ages under 18 = 7%, clients exited ages 18 – 49 = 34%, clients exited ages 50 – 64 = 41%, clients exited ages 65+ = 18%
Safer Ground: Clients Served and Exits by Home City
(As of 9/30/22)

Clients served by city ranges from 5 – 1171, clients exited by city ranges from 4 – 1024, clients exited to housing by city ranges from 3 – 734
Safer Ground: Demographics - Race
(As of 9/30/22)

Point in time count/Safer ground counts – White = 31%/36%, Black or African American = 47%/50%, Asian = 2%/2%, American Indian or Alaska Native = 4%/3%, Native Hawaiin or Other Pacific Native = 2%/1%, Multiples Races = 14%/6%
Safer Ground: Demographics - Ethnicity
(As of 9/30/22)
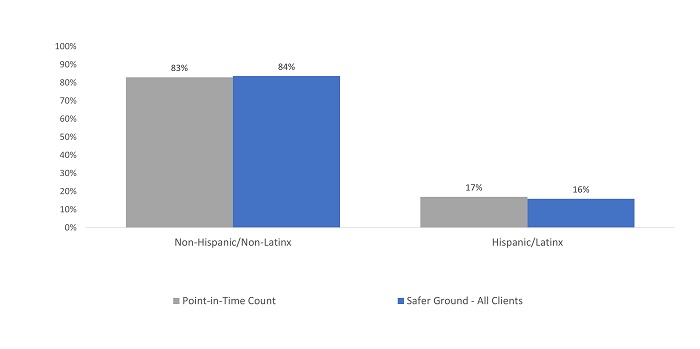
Point-in-time count/Safer Ground count – Non-Hispanic/None-Latinx = 83%/84%, Hispanic/Latinx = 17%/16%
Safer Ground: Demographics – Combined Race and Ethnicity*
(As of 9/30/22)
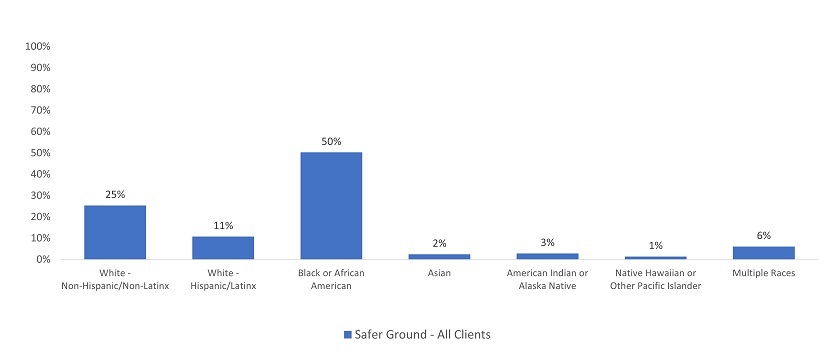
Safer Ground Demographics – White Non-Hispanic/Non-Latinx = 25%, White Hispanic/Latinx = 11%, Black or African American = 50%, Asian = 2%, American Indian pr Alaska Native = 3%, Native Hawaiin or Other Pacific Islander = 1%, Multiple Races = 6%
Operation Safer Ground: Monthly Exits to Housing
(As of 9/30/22)
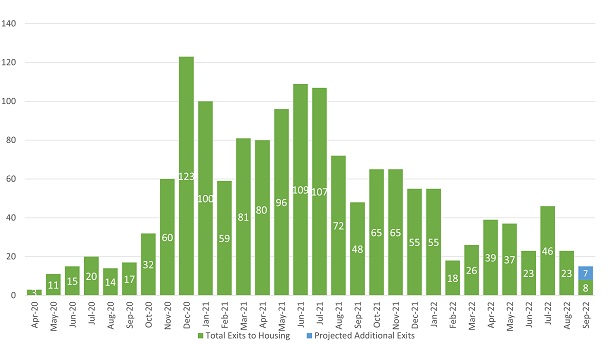
Total Exits to Housing/Projected Additional Exits from April 2020 to September 2022 ranges from 3 to 123